TL;DR: A flat SKU-based product feed tells an AI what a product costs and ships as. A configuration graph tells it what the product actually is — every dimension, material, finish, and modular option — in a format AI can read, evaluate, and recommend. The brands building configuration graphs now are building the infrastructure that defines AI-era visual commerce.
Key points:
-
Flat product feeds were designed for keyword search, not AI evaluation: They cannot represent product complexity: configurations, materials, spatial relationships, modular options. An AI agent evaluating whether a sofa fits a brief cannot work from a title, a price, and a photograph.
-
A configuration graph is the upgrade: A relational data structure that connects 3D geometry (accurate polygons, Physically Based Rendering texture maps, material metadata) directly to commerce attributes (dimensions, durability tiers, material origin, configuration rules), creating a machine-readable product truth layer.
-
The commercial proof already exists: MAKE Nordic's configuration adoption went from 10% to 50% of orders once product complexity became visually navigable through structured 3D data. The product range didn't change. The data infrastructure did.
The flat product feed problem
A flat product feed has a SKU, a price, a title, and a photograph. That was enough for a keyword search engine, which was designed to match query strings against text fields and return ranked results. It is not enough for an AI agent.
AI systems evaluate products against user intent expressed as natural language. When a buyer prompts an agent to find a sustainable modular sofa in warm grey under £1,500 that fits in a room 3.5 metres wide, the agent needs to resolve that brief against actual product data. It needs fabric material origin, per-configuration dimensions, price per variant, and the rules governing which modules connect to which. None of that information lives in a standard product feed. It lives, if it exists at all, in PDF specification documents, inside configurator interfaces agents cannot operate, or in the working knowledge of your sales team.
The result is not a bad ranking. The result is invisibility. An AI agent that cannot resolve a product against a brief will not recommend it — and will not flag that it tried. The brand simply disappears from that buyer's consideration set before any human interaction has occurred.
Nordic furniture retailers face this problem in a particularly concentrated form. The Nordic Retailers Report 2026 notes that consumers in this market frequently purchase without seeing products in person, which means the data and visualization must do the entire work of the showroom. A flat feed cannot do that work. A configuration graph can.
What a configuration graph actually is
A configuration graph is a relational data model where 3D product assets — accurate geometry, Physically Based Rendering (PBR) texture maps, material metadata — are connected to commerce attributes in a queryable structure. It is not a file. It is a set of relationships.
The contrast with a flat feed is easiest to see with a concrete example. A flat feed entry says: Sofa, £899, grey. A configuration graph says: Sofa, modular 2–4 seats, 12 fabric options each with material origin and care code, 3 leg finishes, exact dimensions per configuration, weight per configuration, which fabric options are available with which frame, and photorealistic 3D geometry for every combination.
The difference is not just more data. It is relational data, where the connections between attributes are as important as the attributes themselves. An AI system can traverse those connections to answer the kinds of questions real buyers ask. A flat feed can only be scanned for keyword matches.
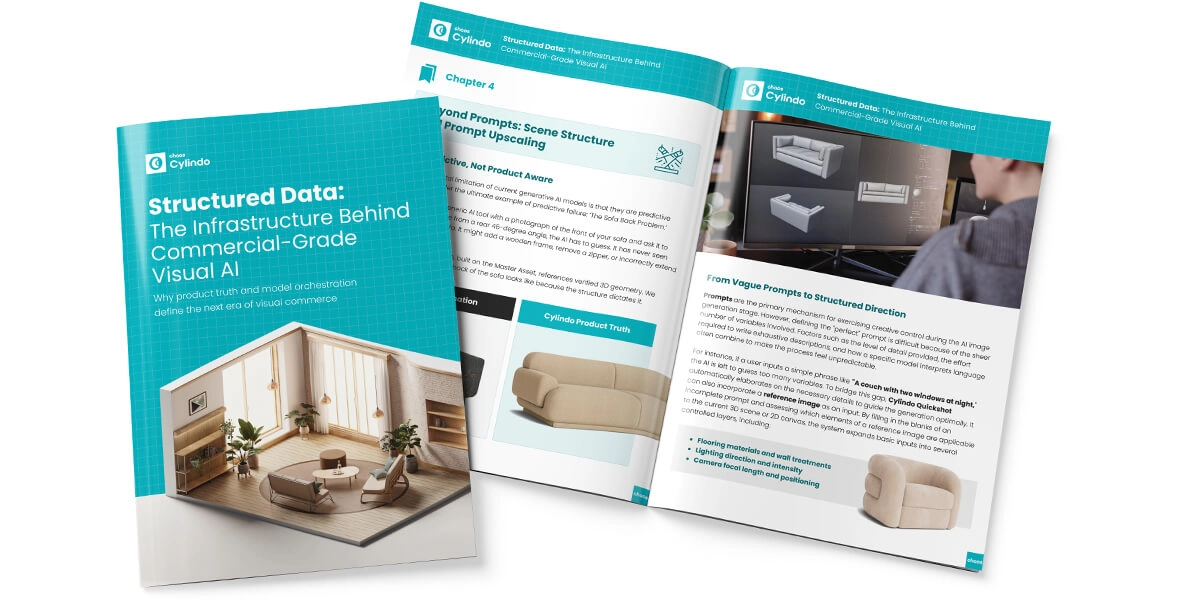
The four layers that make up a complete configuration graph, as defined in Cylindo's Structured Data ebook, are:
-
Configuration Logic: The encoded rules governing how the product can be assembled — which modular pieces connect, which fabrics are available on which frames.
-
Materials: Physically Based Rendering (PBR) shaders that define exactly how a surface interacts with light — roughness, reflectivity, how velvet absorbs versus how brushed steel reflects.
-
Dimensions: Absolute real-world scale to the millimetre, per configuration.
-
Geometry: The structural mesh defining the exact physical shape — depth of cushion, angle of chair back, extension of a chaise.
Together, these four layers create what the Structured Data ebook calls "structured product truth" — the foundational architecture that prevents AI from guessing and makes product data usable at every downstream touchpoint, human and machine alike.
How Cylindo builds the configuration graph
Cylindo's platform builds the configuration graph in two connected layers, then distributes it across every channel from a single verified source.
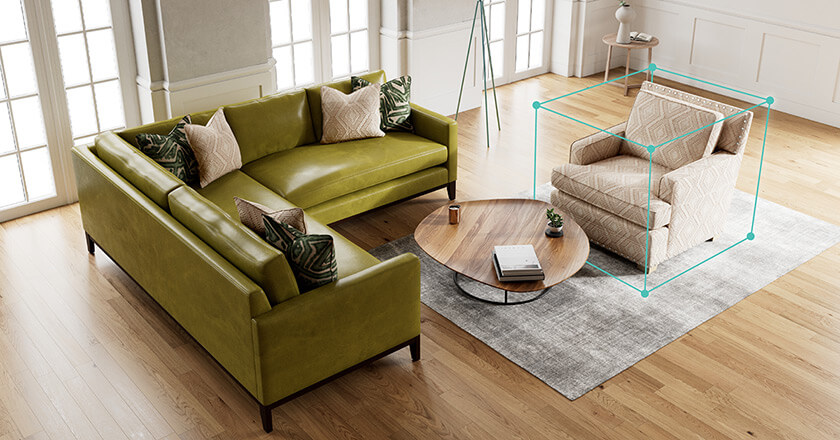
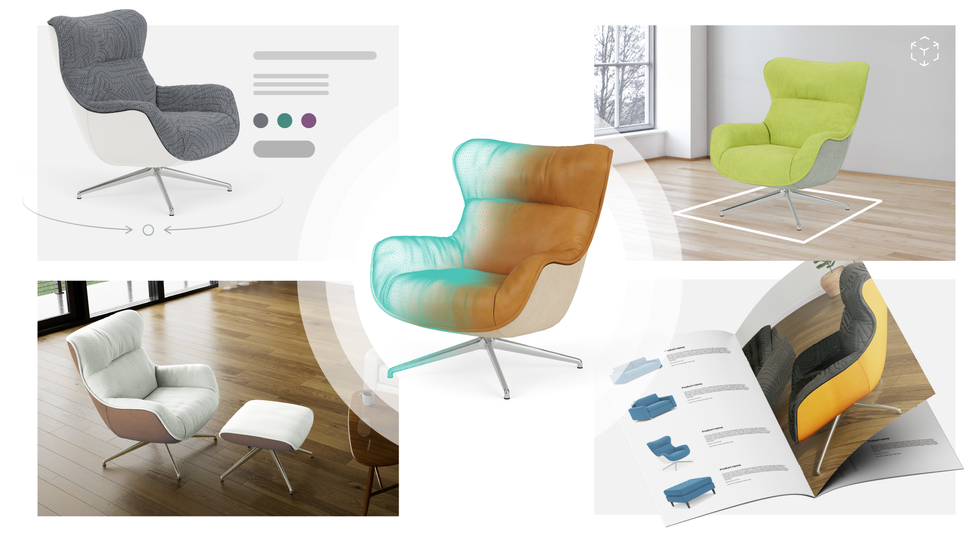
The first layer is the 3D asset: high-fidelity models with accurate geometry, PBR texture maps, and material metadata. This is the visual truth of the product: what it actually looks like from every angle, in every fabric, at every configuration. It is the layer that powers the 360 HD Viewer, the AR experience, and the product configurator on the PDP.
The second layer connects that 3D asset to commerce metadata: dimension data, configuration rules, material specifications, and durability tiers. This is the layer that makes the product readable by AI systems rather than just visible to human shoppers.
Distribution works in two ways depending on the use case. For bulk image asset delivery to marketplaces and retailers — pack shots, detail shots, dimension shots in the exact pixel dimensions each channel requires — Cylindo Export packages and distributes the content at catalog scale. For programmatic, real-time embedding of configured visuals into product feeds, PDPs, recommendation engines, and cart experiences, the Cylindo Content API pushes structured visual data to any endpoint without manual file transfers.
Interior Define used the Content API to embed high-quality configured visuals across every digital touchpoint — from the product category menu to add-to-cart thumbnails — cutting what had been a six-month process to hours.
Proof of Impact: Interior Define
Content API. Every Touchpoint. Consistent Structured Visuals Across the Entire Journey.
Interior Define used Cylindo's Content API to embed photorealistic configured product visuals across every digital touchpoint — product feed, PDP, category menu, recommendations, and cart thumbnails. Cylindo AR adoption rates ran 33 times higher than their previous app-based solution. Customers who engaged with Cylindo AR were eight times more likely to convert than those who didn't.
Read the full case study here.
Commercial proof: what happens when complexity becomes navigable
The argument for configuration graph infrastructure is not theoretical. The commercial evidence exists in the brands that have built it.
Proof of Impact: MAKE Nordic
10% → 50% Configuration Adoption. 5x Increase. Year-on-Year Revenue Growth.
Before Cylindo, roughly 90% of MAKE Nordic customers chose standard pre-configured products. Only 10% engaged with the customisation options. After deploying structured 3D visualization, the split moved to 50/50 — a fivefold increase in customisation adoption. The product range hadn't changed. The configuration data infrastructure had made complexity legible rather than overwhelming, and customers responded by engaging with it.
Read the full case study here.
Landscape Forms took the same infrastructure into a commercial specification context. With a portfolio of modular outdoor furniture serving architects, planners, and procurement teams, the brand deployed Cylindo's Modular Designer to build a web-based 3D configurator across eight product families.
The configurator integrates 70+ high-fidelity 3D assets and supports more than 5 million unique combinations. To date, customers have completed over 2,500 custom configurations — not because the product range expanded, but because the structured data made complex decisions navigable without a sales rep.
The pattern across both cases is the same. Product complexity that previously created friction — too many options, too much uncertainty about what the final product would look and feel like — becomes a commercial advantage once the configuration graph makes it visually legible and machine-readable. Customisation adoption rises. Engagement deepens. AI systems can now evaluate these products accurately against buyer briefs. And the brand's asset library, built once in Cylindo, distributes across every channel without duplication of effort.
The infrastructure decision
The brands that build configuration graph infrastructure now will be readable by AI systems, visible to agentic shoppers, and capable of distributing product truth across every channel from a single verified source.
The brands that don't will continue sending AI agents flat feeds that cannot answer the questions real buyers are asking. Those agents will recommend competitors instead.
The SKU is not dead. It is the foundation of every product record and will remain so. But the SKU alone is no longer a complete representation of a furniture product — not in a market where buyers expect to configure before they commit, where AI agents evaluate structured relationships rather than text strings, and where the same product data needs to power a 360 viewer, an AR experience, a marketplace listing, a B2B specification portal, and an AI product feed simultaneously.
Build above the SKU. The configuration graph is what sits there.
Frequently Asked Questions
What is the difference between a product feed and a configuration graph?
A product feed is a flat list of SKUs with attributes like price, title, and image. A configuration graph is a relational data structure that connects 3D geometry to commerce metadata — dimensions per configuration, material options with specifications, modular assembly rules. It represents what a product actually is, not just what it costs. Cylindo's Master Asset contains four structural layers — Configuration Logic, PBR Materials, Dimensions, and Geometry — that together form the configuration graph.
Why do flat product feeds fail in AI commerce?
AI systems evaluate products against user intent expressed as natural language. A query like "a sustainable modular sofa under £1,500 that fits in a 3m room" requires relational data — fabric material origin, per-configuration dimensions, price per variant. Flat feeds cannot answer that query accurately, so AI agents either skip the product or recommend a competitor whose data is more complete. The result is invisibility, not a lower ranking.
How does Cylindo's platform create configuration graph infrastructure?
By connecting high-fidelity 3D assets — accurate geometry, PBR texture maps, material metadata — to commerce attributes including dimensions, configuration rules, and durability tiers. The Cylindo Content API then distributes this complete structured data set programmatically to any channel endpoint in real time, while Cylindo Export packages image assets in bulk for marketplaces and retailers that require specific file formats and dimensions.
What commercial impact does structured configuration data have?
MAKE Nordic saw customisation adoption increase 5x — from 10% to 50% of orders — once product complexity became visually navigable through structured 3D data. Landscape Forms enabled 2,500+ architect-completed configurations using a structured modular system supporting over 5 million combinations. Interior Define used the Cylindo Content API to embed configured product visuals across every digital touchpoint, with AR adoption running 33 times higher than their previous app-based solution.