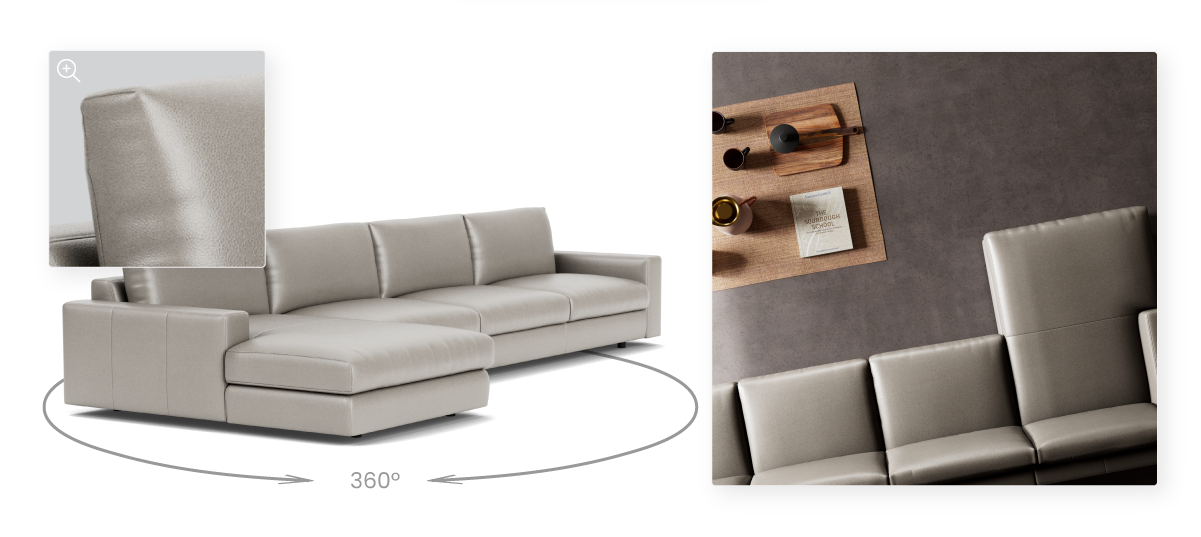

TL;DR: Incomplete product data has three commercial costs. Higher return rates from customers who could not verify fit. Lost specifications from B2B buyers who could not find the data they needed. And complete invisibility to AI shopping agents that skip brands with incomplete metadata. The brands that have structured their product data properly are measuring all three improvements simultaneously.
Key points:
-
The returns cost is visible. The root cause is not. When dimension data is incomplete, fabric colors are misrepresented, or configuration options are locked inside a viewer that does not work on mobile, customers buy products that do not fit their expectations, and return them. Ann Gish saw a 35% reduction in buyer's remorse returns on Wayfair after deploying Cylindo. That did not come from a better product. It came from better data.
-
The B2B specification loss is harder to see but often more expensive. Procurement buyers, architects, and interior designers evaluating furniture for commercial projects move to the competitor whose data is easier to work with. Specification depth wins commercial contracts, and specification depth requires data structured for the buyer to use, not for the marketing team to admire.
-
The AI invisibility cost is the one most brands have not yet learned to measure. AI shopping agents evaluate against structured metadata. Brands with incomplete feeds do not receive a poor recommendation, they receive no recommendation at all. The traffic loss almost never shows up in any dashboard the team currently monitors.
The three costs of incomplete product data
The first commercial cost of incomplete product data shows up in the returns line, the one every finance team can already see, even if they have not traced it back to its source. When dimension data is incomplete or inaccurate, when fabric colors are misrepresented, or when configuration options are locked inside a viewer that does not work on mobile, customers buy products that do not fit their expectations. They send them back.
In the Australian market, a single furniture return can cost the retailer between $400 and $800 in freight alone, before handling or restocking is added. Even in less freight-intensive markets, the all-in cost per return is high enough to erase the margin on multiple completed sales. According to the Cylindo AU Retailers Report 2026, Australian brands are increasingly turning to structured visualization as a return reduction tool precisely because the freight cost makes every avoided return commercially significant. Ann Gish saw a 35% reduction in buyer's remorse returns on Wayfair after deploying Cylindo. That reduction did not come from a better product. It came from better data giving customers the visual confidence they needed to buy the right thing the first time.
The second cost shows up in the B2B pipeline, where it is harder to see but often more expensive. Procurement buyers, architects, and interior designers evaluating furniture for commercial projects rely on complete specification data to build their proposals, validate against project constraints, and defend their recommendations to end clients. When a brand's specifications are incomplete, buried in downloadable PDFs, or inconsistent across the surfaces where the specifier is looking, that buyer moves to a competitor whose data is easier to work with.
Landscape Forms illustrates the upside of getting this right. The brand supports more than 5 million valid configurations through a structured 3D asset library, enabling more than 2,500 custom configurations completed directly by architects, specifiers, and procurement teams, without rep involvement for the exploration phase. Specification depth wins commercial contracts, and specification depth requires data that is actually structured for the buyer to use rather than for the marketing team to admire.
The third cost is the one most brands have not yet learned to measure. AI shopping agents evaluate products against structured metadata, not lifestyle photography, and brands with incomplete feeds simply do not appear in the recommendation set the shopper ultimately sees. The Cylindo US Retailers Report 2026 names fit uncertainty as one of the most persistent barriers to e-commerce conversion in the market, and AI can only resolve that uncertainty when the data exists to resolve it against. There is no poor recommendation and no low-ranking placement to react to. There is only absence, and the traffic loss almost never shows up in any analytics dashboard the team currently monitors.
What the commercial evidence shows
The evidence on what better data actually does to a business has accumulated to the point where the case is no longer speculative.
Ann Gish deployed Cylindo to make it crystal clear for customers, sales reps, and vendor partners exactly what they were buying. Jane Gish, the brand's CEO, describes the priority directly:
"We needed high-quality product visualization to make it crystal clear for our customers, sales reps, and vendor partners."
— Jane Gish, CEO, Ann Gish
The result was a 35% reduction in buyer's remorse returns on Wayfair, a direct measure of how much of the return problem was rooted in inadequate product data rather than in product quality or logistics.
Polly Products tells the parallel story from the marketing side. After deploying 3D visualization, the brand expanded its annual marketing budget from $130,000 to $409,000 alongside a threefold increase in engagement on the new visual content and 17% growth in organic traffic. The mechanism is worth unpacking because it explains why the return on structured data investment tends to compound rather than plateau. Better product data produces better performance data, which produces better attribution, which produces better investment decisions, which unlocks more budget for the growth experiments that already worked. The initial data improvement funded the budget expansion, and the budget expansion funded the next round of growth.
Riverside Furniture rounds out the evidence set from the operational cost angle. By moving from regional photoshoot workflows to Cylindo Studio across its extensive US product catalog and network of more than 3,500 retail locations, the brand saves up to $100,000 annually while keeping visual representation consistent across its full distribution footprint. The savings hold up at genuine scale, which matters because it demonstrates the model does not only work inside smaller, simpler catalogs.
Proof of Impact: Ann Gish
35% Reduction in Buyer's Remorse Returns on Wayfair.
Ann Gish deployed Cylindo visualization to accurately represent their luxury product range on Wayfair. The result was a 35% reduction in buyer's remorse returns, a direct measure of the expectation gap between what shoppers saw and what they received. Accurate, structured product representation builds the purchase confidence that reduces post-delivery regret.
Read the full case study here.
The AI dimension
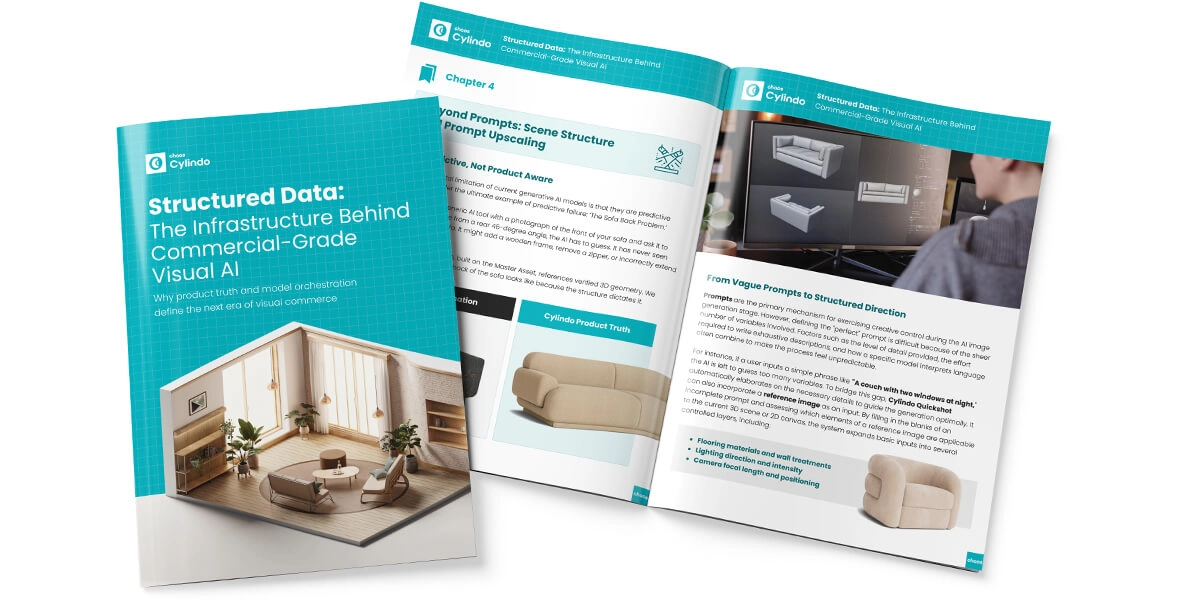
The framing that ties all three costs together most cleanly comes from the Cylindo Structured Data ebook: AI alone generates images, but structured data generates images consumers actually trust. The same principle applies one level up in the funnel to recommendations. AI alone generates suggestions, but structured data is what generates suggestions consumers actually receive from the autonomous systems now deciding which brands appear in their evaluation set.
Absence at the recommendation layer is a cost that will not show up on any dashboard yet, but it is already reshaping which brands compound market share and which brands quietly lose it. For a deeper look at how AI agents evaluate furniture catalogs and what specifically needs to be in place to appear in the recommendation set, read our companion piece on AI search visibility for furniture brands.
The cost dimension is more measurable and more encouraging than most infrastructure investments the CFO is being asked to approve. Across the Cylindo customer base, visualization costs are reduced by an average of 58% according to the Cylindo Nordic and US Retailers Reports 2026. The structured data investment is not a cost line waiting to be defended. It is a cost reduction that also fixes the AI invisibility problem as a byproduct of the same work.
The hidden cost of incomplete product data is ultimately not just what the brand loses in returns and lost specifications. It is the share of wallet the brand never captures from buyers whose AI agents evaluated a competitor's complete data and never reached theirs, and that loss compounds every quarter as agentic commerce takes a larger share of catalog evaluation.
The fix
The architecture that closes all three costs at once is a single high-fidelity 3D asset library, built once on Cylindo's 3D visualization platform, distributing accurate product data to every channel where the brand needs to appear. The same source feeds the website, the marketplace listings, the B2B trade portal, and the AI-readable product feeds, with no version drift and no metadata mismatch between what any given system reads and what any other system reads. Adding a new channel does not require adding a new data pipeline to maintain.
The specific tool that addresses the returns cost most directly is Cylindo Dimension Shots, which generates accurate scale reference imagery across the full catalog without requiring the manual measurement sessions that historically made dimension shots a rare luxury rather than a standard inclusion. In the Australian market, where a single dimension-related return costs $400 to $800 in freight alone, that tool pays for itself in the incidents it prevents rather than in the incidents it optimizes after they happen.
The synthesis is straightforward. Structured 3D product data prevents the losses AI invisibility creates, built once, with effectively zero ongoing cost to maintain relative to the return, specification, and discoverability losses it eliminates.

Frequently Asked Questions
What are the main commercial costs of incomplete product data for furniture brands?
Three. Higher return rates from customers who could not verify fit or dimensions before purchasing. Lost B2B specifications from procurement buyers who moved to a competitor with more complete data. And complete AI invisibility, where shopping agents skip brands whose feeds lack the structured metadata needed to evaluate a product against a buyer's brief. Each of the three costs compounds over time, and the AI invisibility cost is the one most brands have not yet learned to measure.
How much can poor product data cost a furniture brand in returns?
A furniture return in Australia can cost $400 to $800 in freight alone before handling and restocking are added, according to the Cylindo AU Retailers Report 2026. Ann Gish saw a 35% reduction in buyer's remorse returns on Wayfair after deploying Cylindo's visualization platform, at scale, every percentage point of return reduction represents significant recovered margin annually.
How does structured 3D data reduce return rates?
By giving customers accurate, complete visual information before they commit, including accurate dimensions with scale reference, all configuration and fabric options rendered correctly, and AR placement in their actual space. Cylindo Dimension Shots generates accurate scale reference imagery across an entire catalog without manual measurement sessions, meaning customers can verify fit and appearance before purchasing and return at significantly lower rates.
What is the relationship between better product data and marketing ROI?
Polly Products expanded its marketing budget from $130,000 to $409,000 after deploying 3D visualization, because the performance data the new infrastructure made visible justified the investment at CFO level. Better product data enables better attribution, better attribution enables better investment decisions, and the data improvement effectively funds the budget expansion that follows it. The initial data investment funded the next round of growth, a compounding return rather than a one-time saving.