---
title: 7 Factors to Consider When Building Your 3D Furniture Visualization Strategy
description: Choosing the right 3D visualization technology for furniture retail comes down to 7 factors. Here is how to evaluate each one and build the right strategy for your business.
image: https://blog.cylindo.com/hubfs/44_7_things_-_webinar_-_blogpost_-_5.fw-min.jpg
---
[  Cylindo Logo](https://www.cylindo.com/)
- Platform
Overview
- [How it works](https://www.cylindo.com/how-it-works/)
Core Platform
- [Asset Hosting A visual source of truth for every product.](https://www.cylindo.com/platform/core/#asset-hosting)
- [Content Creation Produce channel-ready content at catalog scale.](https://www.cylindo.com/platform/core/#content-creation)
- [Commerce Tools Turn product pages into digital showrooms.](https://www.cylindo.com/platform/core/#commerce-tools)
- [Distribution Compose, push, and measure across channels.](https://www.cylindo.com/platform/core/#distribution)
Bundles
- [Lifestyle Add-on 3D and AI lifestyle imagery tools - (Best for visuals at scale)](https://www.cylindo.com/platform/lifestyle/)
- [3D Design Customize multi-component or multi-product bundles in real time. - (Best for e-commerce)](https://www.cylindo.com/platform/3d-design/)
- [Compare bundles Check which bundle fit your needs](https://www.cylindo.com/platform/compare-bundles/)
[](https://cta-service-cms2.hubspot.com/web-interactives/public/v1/track/click?encryptedPayload=AVxigLI6OOO%2FX2J5LDxKXkS4hv6vtKaU6HSjeVDZjXWZcmceLj8daUydus447qAu%2BlJ559eJAETFdNThy3brmpc78RjSqK91TBGV3DRXWAT9CYaUwQTfpUcS4gyKy0BGxMrUXfiXXfPcuqDC4YFL2Q4t8zSqa5LBCOoe2%2B239nHYL4sjznAmPVn12nKAd0a4eGw%3D&portalId=4585441)
- Use cases
By outcome
- [Convert more shoppers](https://www.cylindo.com/use-cases/outcome/#convert-more)
- [Scale content creation](https://www.cylindo.com/use-cases/outcome/#scale-content)
- [Win across every channel](https://www.cylindo.com/use-cases/outcome/#win-across-every-channel)
By vertical
- [Furniture & home furnishings](https://www.cylindo.com/use-cases/verticals/#home-furniture)
- [Kitchen & bath](https://www.cylindo.com/use-cases/verticals/#kitchen-bath)
- [Lighting](https://www.cylindo.com/use-cases/verticals/#lighting)
- [Cabinetry](https://www.cylindo.com/use-cases/verticals/#cabinetry)
- [Outdoor living](https://www.cylindo.com/use-cases/verticals/#outdoor-living)
- [Contract & commercial](https://www.cylindo.com/use-cases/verticals/#contract-commercial)
By team
- [Creative](https://www.cylindo.com/use-cases/team/#creative)
- [Marketing](https://www.cylindo.com/use-cases/team/#marketing)
- [Digital & E-commerce](https://www.cylindo.com/use-cases/team/#digital-e-commerce)
###### [ Boosts online revenue +75% and AOV +44% with Cylindo Read more \>](https://cta-service-cms2.hubspot.com/web-interactives/public/v1/track/click?encryptedPayload=AVxigLKugaXLIJ%2FBi8rQ6ZH3KScymjpgFZMcslnX61buCaP7eztqyM%2FImxHLX0dtAnupUJVVBxkGawM3jYjCADACR7YiwNpGfaglek7MHXGRWftKwG7GteizyxZu8v4WpsEWrFZus%2Fqgv%2Fptk4DWBS%2FxWd2Sz72hNE9rvQIpn%2FyvuOFQoOyDEsBtEbUQ7wUe8xfZasMvt6gQZf%2FMx0eDGfZRZoo6%2BBs%3D&portalId=4585441)
- Customers
Customers
- [Customer Stories](https://www.cylindo.com/customer-case-studies/)
- [Customer Showcase](https://www.cylindo.com/customers/customer-showcase/)
Who we serve
- [B2B](https://www.cylindo.com/customers/who-we-serve/#b2b)
- [B2C](https://www.cylindo.com/customers/who-we-serve/#b2c)
###### [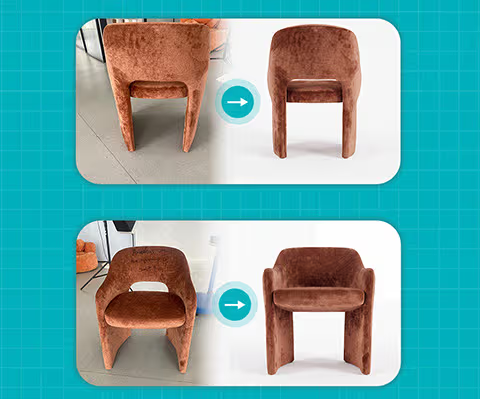 Introducing AI Master Assets Send four product photos and Cylindo produces four studio-quality silo shots in your chosen material, anchored to a 3D asset, with no content creation fee. Read more \>](https://cta-service-cms2.hubspot.com/web-interactives/public/v1/track/click?encryptedPayload=AVxigLKSbU1o5Ysj%2BcPHemzhD%2BQkYuIdvXHUOoj2SSm65frD8BvU5oP5VLFHOkvUADHGADgl04yRtO%2F3Jqiaet2IuCz1XbqguPoyO3c92XWtIN8Q898MYXZrbe2u9R7UN8Ce1CUFr5%2BOkaGZ22CGY8pDTNfyy3htJSI3nfzs96PEjUL2WpHb6vVuwzjqYeFJvRYAJpVWvH4l8jP9&portalId=4585441)
- Resources
Learn
- [Blog](https://blog.cylindo.com)
- [Cylindo library](https://www.cylindo.com/cylindo-content-library/)
Evaluate
- [ROI calculator](https://www.cylindo.com/roi-calculator/)
- [AI Master Assets test](https://www.cylindo.com/ai-master-assets-test/)
- [Business Impact](https://www.cylindo.com/business-impact/)
- [Free custom 3D and AI report new See what 3D + AI could be worth to your brand. Free custom report + ROI model in 48h.](https://www.cylindo.com/custom-report/)
- [Free AI readiness report new See how ChatGPT, Claude & Perplexity read your product pages, plus your top 10 fixes.](https://www.cylindo.com/ai-readiness-report/)
Support
- [Help center](https://learn.cylindo.com/help)
- [Ask support](https://learn.cylindo.com)
- [Change log](https://learn.cylindo.com/changelog)
###### [ Modern Search Discoverability Guide Learn how Google's 2026 AI search updates affect furniture discovery—and what to do to keep your products visible in AI-powered search. Download \>](https://cta-service-cms2.hubspot.com/web-interactives/public/v1/track/click?encryptedPayload=AVxigLJEl7T5dyLLkk%2FWEwwy6TlSBb9kSsYlkDUJ6tN9HhhUvn2hsLUaVYADFKjCAZUMYOr%2BPNOJgpkY2PJicVb3%2FGWl538Jmd3qJuCz8hf19svC47f2bjpQkoTlSgztHrzKcSDNaxvFrc0rZaFt1%2F75i9%2FVuns6K6Hkjfj7dt3UXOSlN1T4Ca%2Bt77aBq2Sgij0EtMCEjYZ%2Bc6O4olPgSsi2vkIcBzleG5bv9eDOO4D%2B%2BwNV2TMwtKv4x3g%3D&portalId=4585441)
- [Book demo](https://www.cylindo.com/book-meeting/)
- [Receive pricing](https://www.cylindo.com/receive-pricing/)
- [Login](https://app.cylindo.com/login)
- Platform
Overview
- [How it works](https://www.cylindo.com/how-it-works/)
Core Platform
- [Asset Hosting A visual source of truth for every product.](https://www.cylindo.com/platform/core/#asset-hosting)
- [Content Creation Produce channel-ready content at catalog scale.](https://www.cylindo.com/platform/core/#content-creation)
- [Commerce Tools Turn product pages into digital showrooms.](https://www.cylindo.com/platform/core/#commerce-tools)
- [Distribution Compose, push, and measure across channels.](https://www.cylindo.com/platform/core/#distribution)
Bundles
- [Lifestyle Add-on 3D and AI lifestyle imagery tools - (Best for visuals at scale)](https://www.cylindo.com/platform/lifestyle/)
- [3D Design Customize multi-component or multi-product bundles in real time. - (Best for e-commerce)](https://www.cylindo.com/platform/3d-design/)
- [Compare bundles Check which bundle fit your needs](https://www.cylindo.com/platform/compare-bundles/)
- Use cases
By outcome
- [Convert more shoppers](https://www.cylindo.com/use-cases/outcome/#convert-more)
- [Scale content creation](https://www.cylindo.com/use-cases/outcome/#scale-content)
- [Win across every channel](https://www.cylindo.com/use-cases/outcome/#win-across-every-channel)
By vertical
- [Furniture & home furnishings](https://www.cylindo.com/use-cases/verticals/#home-furniture)
- [Kitchen & bath](https://www.cylindo.com/use-cases/verticals/#kitchen-bath)
- [Lighting](https://www.cylindo.com/use-cases/verticals/#lighting)
- [Cabinetry](https://www.cylindo.com/use-cases/verticals/#cabinetry)
- [Outdoor living](https://www.cylindo.com/use-cases/verticals/#outdoor-living)
- [Contract & commercial](https://www.cylindo.com/use-cases/verticals/#contract-commercial)
By team
- [Creative](https://www.cylindo.com/use-cases/team/#creative)
- [Marketing](https://www.cylindo.com/use-cases/team/#marketing)
- [Digital & E-commerce](https://www.cylindo.com/use-cases/team/#digital-e-commerce)
- Customers
Customers
- [Customer Stories](https://www.cylindo.com/customer-case-studies/)
- [Customer Showcase](https://www.cylindo.com/customers/customer-showcase/)
Who we serve
- [B2B](https://www.cylindo.com/customers/who-we-serve/#b2b)
- [B2C](https://www.cylindo.com/customers/who-we-serve/#b2c)
- Resources
Learn
- [Blog](https://blog.cylindo.com)
- [Cylindo library](https://www.cylindo.com/cylindo-content-library/)
Evaluate
- [ROI calculator](https://www.cylindo.com/roi-calculator/)
- [AI Master Assets test](https://www.cylindo.com/ai-master-assets-test/)
- [Business Impact](https://www.cylindo.com/business-impact/)
- [Free custom 3D and AI report new See what 3D + AI could be worth to your brand. Free custom report + ROI model in 48h.](https://www.cylindo.com/custom-report/)
- [Free AI readiness report new See how ChatGPT, Claude & Perplexity read your product pages, plus your top 10 fixes.](https://www.cylindo.com/ai-readiness-report/)
Support
- [Help center](https://learn.cylindo.com/help)
- [Ask support](https://learn.cylindo.com)
- [Change log](https://learn.cylindo.com/changelog)
- [Book demo](https://www.cylindo.com/book-meeting/)
- [Receive pricing](https://www.cylindo.com/receive-pricing/)
- [Login](https://app.cylindo.com/login)
[Back to Blog](https://blog.cylindo.com/all)
# 7 Factors to Consider When Building Your 3D Furniture Visualization Strategy

[Biljana Vidojevic](https://blog.cylindo.com/author/biljana-vidojevic) Updated: July 21, 2026
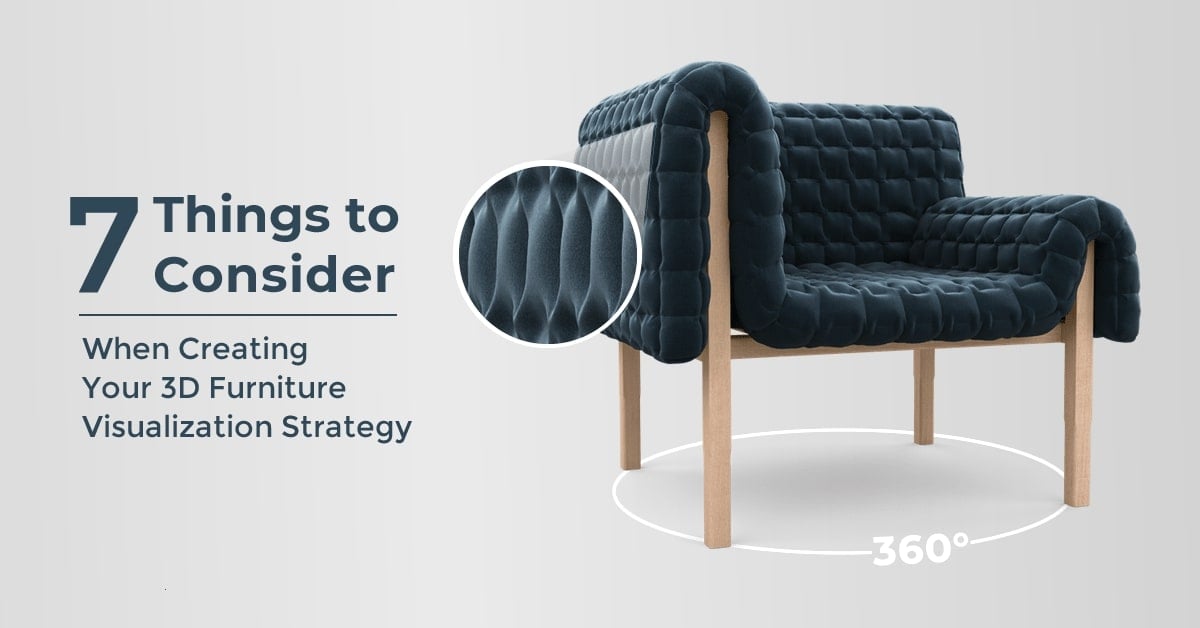
> TL;DR: Choosing the right 3D visualization technology is not a single decision: it requires seven. Asset type, primary users, ideal channel, expected ROI, adoption rate, use cases, and investment cost each point toward a different technology, and getting one wrong wastes the others. This guide walks through all seven factors so you invest in the right infrastructure from the start.
### Key points:
- Build on high-fidelity 3D assets first. High poly assets can be converted to low poly for AR and spatial applications. The reverse is impossible. Starting with high-fidelity 3D creates a future-proof foundation that powers every downstream channel from a single verified asset library.
- Web-native AR has changed the adoption equation. App-based AR faced a fundamental friction problem: most furniture shoppers would not download a dedicated app for an infrequent purchase. Web-native AR removes that barrier entirely. Interior Define saw 33 times higher AR adoption after switching from app-based to web-native, with customers eight times more likely to convert.
- The ROI calculus has shifted toward measurable outcomes. The brands seeing the strongest return from 3D visualization investment are measuring it the same way they measure any other operational expenditure: conversion rate lift, AOV increase, return rate reduction, and content cost savings. EQ3's 36% conversion increase and 88% AOV lift after deploying Cylindo's 3D suite are the benchmark the industry is now measuring against.
## The importance of a visualization strategy
Furniture retail is omnichannel, and it requires both online and in-store interactions before the consumer is ready to buy. Today, the furniture purchase journey starts online for more than 70% of consumers. The quality of the product visualization experience at every digital touchpoint has a direct and measurable impact on whether that journey ends in a purchase.
The furniture industry has moved decisively from product photography and 2D assets to 3D. While 2D assets are static, difficult to modify, and costly to repurpose, 3D assets are structured, scalable, and can be distributed across every channel from a single verified source. The question for most brands is no longer whether to invest in 3D visualization, but how to sequence that investment strategically so that each technology builds on the last rather than creating a fragmented content infrastructure.
Without further ado, here are the seven factors to consider before committing to a furniture visualization strategy:
## 1. 3D asset type
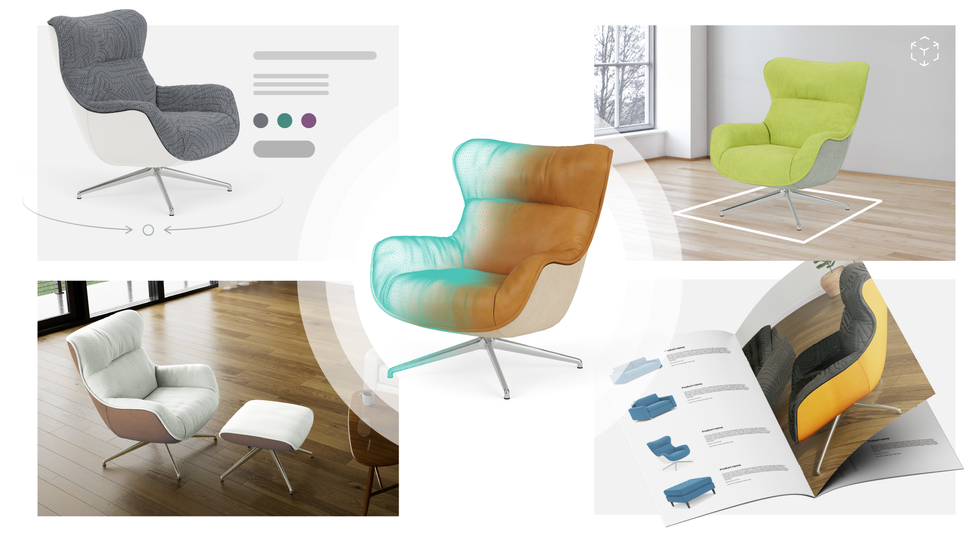
There are two types of assets required to power 3D visualization technologies: high and low polygon assets. A low poly asset has a small number of polygons: it demonstrates basic shape but lacks detail and photorealism. High poly assets have an enormous number of polygons, creating superior finishes and a photorealistic look that is indistinguishable from photography.
High poly assets power [3D product visualization](https://www.cylindo.com/) platforms. AR, VR, and space planning tools are typically powered by low poly assets, which is why those visualizations are not photorealistic and cannot be repurposed for product feeds, marketing campaigns, catalogs, or AI product data.
The most important rule in 3D asset strategy: **you can convert high poly models to low poly, but not the other way around.**
**Strategic tip:** Build your core asset library on high poly 3D from the start. Once you have high-fidelity assets, launching AR or spatial applications is straightforward. Those use cases simply reference the existing library. Building in the opposite direction locks you out of the highest-quality visual outputs permanently.
## 2. Primary users
Technology adopted without a clear user in mind tends to underperform. Before committing to any visualization technology, identify who the primary users are and whether the experience is genuinely suited to them.
The primary users of 3D product visualization and web-native AR are consumers, and the behaviour data shows this clearly. Sofacompany saw a 19% unprompted AR activation rate after deploying Cylindo's web-native AR: nearly one in five product page visitors chose to use AR without any prompt beyond a visible button. That is not a tech-forward niche. That is mainstream consumer behaviour.
Space planning tools have a steeper learning curve and are better suited to guided, assisted selling in-store, where a knowledgeable sales associate can walk a customer through the process of configuring an entire room. They are not primarily self-service consumer tools.
**Strategic tip:** Know exactly who will interact with each technology and whether that interaction requires assistance. The best ROI from 3D visualization comes from experiences consumers can navigate independently, at the moment they are most engaged with the product.
## 3. Ideal channel
Every visualization technology has a channel where it performs best. Deploying the right technology in the wrong channel reduces adoption and distorts your ROI measurement.
- 3D product visualization with 360-spin: effective both online and in-store. Online it creates an engaging, self-service product exploration experience. In-store, it creates an endless aisle. Sales associates can show every configuration on a tablet without being constrained by floor models.
- Web-native AR: primarily online, but increasingly deployed in-store via QR codes on showroom tags and sales associate tablets. FEST Amsterdam equips store associates with tablets running Cylindo AR during in-store design consultations, showing customers their chosen configuration at true scale in their actual home.
- Space planning: primarily in-store. Best suited to customers planning to furnish an entire room or home, where the complexity of spatial arrangement justifies the guided interaction.
**Strategic tip:** Think in terms of where each technology reaches the most customers with the least friction. 3D product visualization provides the most versatility: it bridges online and in-store, powers AR, and generates every downstream content asset from one source. Start there.
#### Proof of Impact: EQ3
+36% Conversions. +88% AOV. +116% Page Views. AR Users Convert at 112% Higher Rate.
EQ3 deployed Cylindo's 360 HD Viewer and web-native AR across their product range. Customers using AR converted at a 112% higher rate than those who did not, with AR users spending twice as much on average. EQ3 also extended AR to desktop users via a QR code pop-up, giving their entire ecommerce audience access to the experience, not just mobile visitors.
Read the full case study [here](https://www.cylindo.com/customer-case-studies/eq3/).
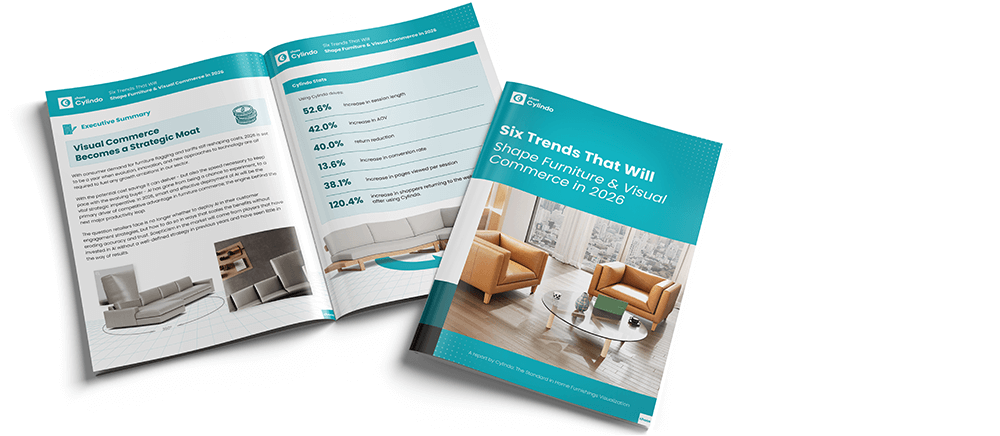
Free Report
### Six Trends That Will Shape Furniture & Visual Commerce in 2026
Discover how leading furniture brands are using AI content, rich PDP visualization, and real-time configuration to drive trust, conversions, and ROI.
[Get the Report](https://www.cylindo.com/cylindo-content-library/reports/6-trends-that-will-shape-furniture-and-visual-commerce-2026/?utm_source=organic&utm_medium=blog&utm_campaign=trends-report-2026&utm_content=inline-report-cta)
## 4. Expected ROI
The starting point for any visualization strategy is defining your goals. Different technologies produce different commercial outcomes, and choosing a technology before setting the goal produces poor results and poor attribution.
For 3D product visualization, the commercial case is well-documented. Retailers using Cylindo's full visualization suite convert 35% or more compared to those relying on static images. Retailers who already have some visualization strategy in place but switch to Cylindo see an average 13.6% jump in conversions. The Cylindo platform drives a 52.6% increase in session length, a 42.0% increase in average order value, a 40.0% reduction in returns, and a 120.4% increase in returning shoppers, all sourced from the [Six Trends That Will Shape Furniture](https://www.cylindo.com/cylindo-content-library/reports/6-trends-that-will-shape-furniture-and-visual-commerce-2026/) and Visual Commerce in 2026 report.
For web-native AR specifically, the conversion lift is direct and measurable. Interior Define saw customers who engaged with AR eight times more likely to convert, with web-native AR adoption running 33 times higher than their previous app-based solution. EQ3 AR users converted at 112% higher rate with twice the AOV.
The 58% average reduction in visualization costs ([Cylindo Nordic and US Retailers Reports 2026](https://www.cylindo.com/cylindo-content-library/reports/top-10-nordic-furniture-retailers-report-2026/)) reframes the ROI conversation: the right visualization infrastructure does not just drive revenue. It replaces a photoshoot-based cost structure that scales poorly with a 3D asset library that scales efficiently.
**Strategic tip:** Define your primary ROI target before evaluating technologies. Conversion rate, AOV, return reduction, and content cost savings each point toward slightly different implementation priorities. The most durable strategies target all four simultaneously, which is the case for high-fidelity 3D as the foundation.
## 5. Adoption rate
If you introduce a technology, you want as many of your customers as possible to actually use it. Adoption rate is the metric that determines whether your visualization investment reaches its target audience.
3D product visualization on the product page has near-100% exposure. Every visitor who lands on a product page with a 360 viewer sees the 3D visuals. There is no friction, no download, no learning curve.
Web-native AR adoption is now meaningfully higher than the app-based AR of previous years. Sofacompany saw a 19% unprompted AR activation rate, with nearly one in five PDP visitors chose to launch AR without any prompt. For context, most optional interactive features on product pages see single-digit engagement. That figure represents mainstream adoption, not early-adopter behaviour.
Space planning tools have a more selective adoption profile. They are most appropriate for customers planning to furnish an entire room or home, where the spatial configuration complexity justifies the guided experience. For single-product purchases, the overhead of space planning typically exceeds what the customer needs.
**Strategic tip:** Prioritise the technology that reaches the most customers first. Your product page is the highest-traffic point in your digital experience. Making that experience photorealistic, configurable, and AR-enabled reaches every visitor, not just those willing to download an app or engage with a space planner.
## 6. Use cases
Different technologies solve different problems. Deploying the right technology for the wrong use case produces underwhelming results and incorrect conclusions about the technology itself.
- 3D product visualization: product configuration, catalog scalability, omnichannel content distribution, AI product feeds, and lifestyle imagery generation. MAKE Nordic moved from 10% to 50% customization adoption after deploying Cylindo's Modular Designer: a 5x increase driven by making configuration visually explorable rather than text-listed. Landscape Forms supports 5 million+ combinations across commercial specification workflows using the same infrastructure.
- Web-native AR: spatial fit verification, in-home product placement, size and scale confirmation. The use case is specific: customers who need to know whether a product fits their space before committing. For high-AOV categories like outdoor furniture and large sofas, this single use case resolves the primary objection to purchase.
- Space planning: full-room or home configuration for customers planning a complete interior. Best in guided, assisted sales environments where a store associate can help navigate the complexity.
- AI product feeds: an emerging use case driven by AI shopping agents querying product catalogs on behalf of buyers. High-fidelity 3D assets that encode geometry, dimensions, PBR materials, and configuration rules are the same structured data that makes products machine-readable and AI-recommendable. Brands building 3D infrastructure now are building AI discoverability simultaneously.
**Strategic tip:** A 3D asset library built on Cylindo's platform serves every use case from a single source: the 360 viewer, AR, configurator, lifestyle imagery, dimension shots, and AI product feeds all draw from the same verified asset. Build once, deploy to every channel simultaneously.
#### Proof of Impact: MAKE Nordic
10% to 50% Customization Adoption. 5x Increase. YoY Revenue Growth.
MAKE Nordic's ratio moved from 90% standard orders and 10% customised to a 50/50 split after deploying Cylindo's Modular Designer. The 5x increase in customization adoption contributed directly to year-over-year revenue growth. The product range did not change. The visual infrastructure that made configuration explorable did.
Read the full case study [here](https://www.cylindo.com/customer-case-studies/makenordic/).
## 7. Investment cost
Investment cost should always be evaluated through three lenses simultaneously: the upfront cost, the expected ROI, and the adoption rate that will determine whether that ROI is realised. A cheap technology with low adoption and poor ROI is not a bargain. An expensive technology with high adoption and measurable revenue impact is a capital allocation decision, not a cost.
For 3D product visualization, the cost structure has shifted significantly. Across Cylindo's customer base, visualization costs are reduced by an average of 58% compared to photography-based workflows (Cylindo Nordic and US Retailers Reports 2026). The infrastructure investment replaces a photoshoot-based cost model that scales poorly with a 3D asset library that generates unlimited variants at no marginal cost.
Web-native AR has no hardware cost for the consumer and no app distribution cost for the brand. The investment is in the 3D asset quality that makes AR trustworthy, which is the same investment that powers the 360 viewer and configurator. There is no separate AR cost layer when the underlying 3D infrastructure already exists.
**Strategic tip:** Define all seven factors before committing to any visualization technology. The goal is not to invest in the cheapest option or the most impressive demo. It is to invest in the infrastructure that will deliver your target ROI at scale, with the adoption rate to realise it.
Deciding on the right [3D product visualization technology](https://www.cylindo.com/) is a multifaceted process, and the seven factors above work together rather than in isolation. A technology with the right asset type, aimed at the right users, deployed in the right channel, with a clear ROI target, high adoption, a specific use case, and a justified investment cost is the definition of a furniture visualization strategy that actually works. The brands that have worked through all seven are the ones compounding the advantage.
Platform Demo
### Book your free demo
Leading companies worldwide are using Cylindo to deliver superior omnichannel product experiences. Want to see why and what you can do with it?
[Book a Demo](https://www.cylindo.com/book-meeting/?utm_source=organic&utm_medium=blog&utm_campaign=visualization-strategy&utm_content=inline-demo-cta)
### Frequently Asked Questions
#### What should retailers consider when evaluating 3D product visualization software?
Seven factors: asset type (high poly vs low poly, and future-proofing), primary users (consumer self-service vs associate-guided), ideal channel (online, in-store, or both), expected ROI (conversion, AOV, return reduction, or cost savings), adoption rate (how many customers will actually use it), use cases (product configuration, AR, AI feeds), and investment cost evaluated against those ROI targets. A technology that scores well on all seven is the right choice. A technology that excels on one but fails on three others will underperform expectations.
#### What is the difference between high poly and low poly 3D assets for furniture?
High poly assets contain an enormous number of polygons, producing photorealistic finishes that are indistinguishable from photography. Low poly assets have fewer polygons, making them suitable for AR and VR but unable to deliver photorealistic quality. The critical strategic implication: high poly can be converted to low poly, but the reverse is impossible. Building your core asset library on high poly 3D from the start creates a foundation that powers every downstream use case (visualization, AR, AI feeds, lifestyle imagery) without rebuilding.
#### What ROI can furniture brands expect from 3D visualization investment?
Retailers using Cylindo's full visualization suite convert 35% or more compared to those using static images. Brands that already have visualization but switch to Cylindo see an average 13.6% conversion increase. The platform drives a 52.6% increase in session length, 42.0% AOV increase, 40.0% return reduction, and 120.4% increase in returning shoppers. Visualization costs are reduced by an average of 58% compared to photography-based workflows. The ROI case is both revenue-side and cost-side simultaneously.
#### Is AR a viable channel for furniture retail in 2026?
Yes, specifically web-native AR. App-based AR faced a fundamental adoption barrier: furniture is an infrequent purchase and most shoppers would not download a dedicated app for a category they buy every few years. Web-native AR removes that barrier entirely. Sofacompany saw a 19% unprompted AR activation rate after deploying Cylindo's web-native AR. Interior Define saw 33 times higher adoption compared to their previous app-based solution, with those customers eight times more likely to convert. Web-native AR is mainstream consumer behaviour, not early-adopter territory.

## Biljana Vidojevic
Content creator. The person behind the Cylindo blog. Excited about the future of technology and retail.
## [ Free test Get studio-quality product visuals in 24 hours. Try AI Assets](https://www.cylindo.com/ai-master-assets-test/)
## Subscribe to our monthly newsletter.
Share
## [ Previous Get Ready For the Holiday Season: Tips to Speed Up Your Website and Increase Sales](https://blog.cylindo.com/page-load-time-holiday-sales/)
## [ Next 6 Trends for Furniture E-Commerce Success in 2019 - What the Experts Predict](https://blog.cylindo.com/6-trends-for-furniture-e-commerce-success-in-2019-expert-roundup/)
## Related Posts
[](https://www.chaos.com/)
Platform
- [How it works](https://www.cylindo.com/how-it-works/)
- [Core platform](https://www.cylindo.com/platform/core/)
- [Lifestyle bundle](https://www.cylindo.com/platform/lifestyle/)
- [3D design bundle](https://www.cylindo.com/platform/3d-design/)
- [Compare bundles](https://www.cylindo.com/platform/compare-bundles/)
Products
- [Augmented reality](https://www.cylindo.com/platform/products/augmented-reality/)
- [Curator](https://www.cylindo.com/platform/products/curator/)
- [Create](https://www.cylindo.com/platform/products/export/)
- [Analytics](https://www.cylindo.com/platform/products/analytics/)
- [Dimension shots](https://www.cylindo.com/platform/products/dimension-shots/)
- [Quickshot](https://www.cylindo.com/platform/products/quickshot/)
- [Studio](https://www.cylindo.com/platform/products/studio/)
- [Modular Designer](https://www.cylindo.com/platform/products/modular-designer/)
Company
- [About](https://www.cylindo.com/about-us/)
- [Leadership](https://www.cylindo.com/about-us#leadership)
- [Contact us](https://www.cylindo.com/about-us#contact-us)
- [Careers](https://careers.chaos.com/)
- [News](https://www.chaos.com/press)
Resources
- [Customer Success Stories](https://www.cylindo.com/customers/customer-stories/)
- [Customer Showcase](https://www.cylindo.com/customers/customer-showcase/)
- [Learning center](https://learn.cylindo.com/help)
- [Cylindo Blog](https://blog.cylindo.com)
- [Cylindo Library](https://www.cylindo.com/cylindo-content-library/)
- [Furniture Briefings](https://resources.cylindo.com/furniture-briefings-subscribe)
## Follow us
-
-
-
-
© 2026 Cylindo. All Rights Reserved.
- [Cookie policy](https://www.cylindo.com/cookies-policy/)
- [Privacy policy](https://www.cylindo.com/privacy/)
```json
{
"@context" : "https://schema.org",
"@type" : "FAQPage",
"mainEntity" : [ {
"@type" : "Question",
"acceptedAnswer" : {
"@type" : "Answer",
"text" : "Seven factors: asset type, primary users, ideal channel, expected ROI, adoption rate, use cases, and investment cost. A technology that scores well on all seven is the right choice. A technology that excels on one but fails on three others will underperform expectations."
},
"name" : "What should retailers consider when evaluating 3D product visualization software?"
}, {
"@type" : "Question",
"acceptedAnswer" : {
"@type" : "Answer",
"text" : "High poly assets contain an enormous number of polygons, producing photorealistic finishes. Low poly assets have fewer polygons, suitable for AR and VR but unable to deliver photorealistic quality. The critical implication: high poly can be converted to low poly, but not the reverse. Building on high poly from the start future-proofs every downstream use case."
},
"name" : "What is the difference between high poly and low poly 3D assets for furniture?"
}, {
"@type" : "Question",
"acceptedAnswer" : {
"@type" : "Answer",
"text" : "Retailers using Cylindo's full visualization suite convert 35% or more compared to those using static images. The platform drives a 52.6% increase in session length, 42.0% AOV increase, 40.0% return reduction, and 120.4% increase in returning shoppers. Visualization costs are reduced by an average of 58% compared to photography-based workflows."
},
"name" : "What ROI can furniture brands expect from 3D visualization investment?"
}, {
"@type" : "Question",
"acceptedAnswer" : {
"@type" : "Answer",
"text" : "Yes, specifically web-native AR. Sofacompany saw a 19% unprompted AR activation rate. Interior Define saw 33 times higher adoption compared to their previous app-based solution, with those customers eight times more likely to convert. Web-native AR is mainstream consumer behaviour in furniture retail."
},
"name" : "Is AR a viable channel for furniture retail in 2026?"
} ]
}
```